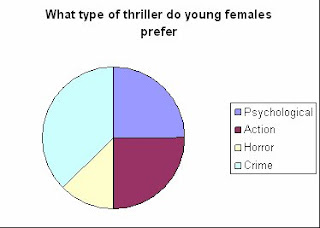
 This graph can easily show us that females of a young age (16 - 25), would prefer to watch a crime thriller over the others, with action and psychological in second and horror in last. This can give us a general idea of what time of thriller to create if our target audience were younger women. I don't think that this could be valid for all members of our target audience and more results would make the overall much more acurate.
For people of the same age, but of a different sex the results came out rather different. Males clearly favoured action thrillers over the others and no section of the results were crime thrillers. This could be tricky when making our thriller because 2 main groups that we would be targeting have different tastes in thrillers. Although the females didn't vote action as their favourite they did get reasonable results for action and psychological. Again, more results would increase accuracy of our findings.

 Again the age group used here do not match our main target audience, but you can see from the graph that crime and action have come in first place, so these two options seem to be rather popular. And even though we won't try to make our film to suit this audience, they can help with an overall look for more valid results to the general population.
The overall scores seem very close, but you can see that action and crime came in joint first, so the majority of people would like to see either of these types of thrillers, and as results are extremely close it seems our thriller would be watched whether it was any of these types. Results could of easily been made greater if we gave out more questionnaires to begin with and we offered more options to choose from.


The overall outcome is inevitable that male lead roles won the majoirty vote.
2 comments:
You need to develop this entry and explain how the results from yoru questionnaire influenced your thriller planning. Your analysis needs to be much more detailed and you also need a full audience profile.
Thoughful evaluation of data which is linked to planning production.
Proficient and reflecting engagement.
Level 3: 13/20
Post a Comment